Paying for Tomorrow: Revenue Projections From Top Percentile Taxes
Brattleboro Common Sense
Adam Marchesseault
Fall 2020
Summary
This document is an analysis of the revenue-generating potential of local taxes on the incomes and wealth of Vermont’s richest residents, calculated for the Brattleboro Common Sense “Wall Street Tax” project, which seeks to improve the fairness of the state and local tax code. Specifically, it analyzes the following policy proposals in the context of Brattleboro:
-
- An income tax of 3% per year on all household income over $200,000.
- A wealth tax of 1% per year on all investable assets (i.e. net worth minus real estate and retirement accounts) over $5,000,000.
At the state level, the proposed taxes are modified as follows:
-
- The 3% annual income tax applies to “top percentile” income, i.e. household income above the threshold of the top 1% of Vermont households. This figure will automatically adjust annually, to reflect current IRS data; as of 2019, the threshold was roughly $319,000.
- The 1% annual wealth tax is analyzed at both a $5,000,000 and $10,000,000 investable asset threshold, rather than just $5,000,000. This reflects differences in average top percentile wealth between Brattleboro and Vermont as a whole, as the rest of the state has a considerably higher Gini coefficient than Brattleboro, and a 1% that is, by and large, wealthier than that of Brattleboro.
Calculations of the figures involved with each tax for Brattleboro were based largely upon a mix of upper-level income data, comparisons between rates of income and wealth (and the distribution therein) among top 1% households in the US, and estimates of average 1% income and wealth in Brattleboro are based on comparisons between threshold 1% income in Brattleboro and Vermont as a whole, with Brattleboro’s income distribution among the 1% modeled after that of Vermont. It is estimated that the finances of Brattleboro’s 1% can be summarized as follows:
-
- There are 36 households, roughly, that make up Brattleboro’s 1%
- 1.06% of Brattleboro households make more than $200,000 per year, so that is considered the loose threshold of 1% income in Brattleboro
- The average 1% household in Brattleboro likely earns $471,000 per year, an estimated mean with a range of $434,000-$508,000 per year
- The threshold net worth to be in Brattleboro’s 1% is roughly $4 million, or $3 million in investable assets
- The average net worth of Brattleboro’s 1% is roughly $9.4 million, with average investable assets of $7.1 million. This average is an estimated mean within a range of $6.5-7.7 million
With this information in mind, calculating potential revenue from the above tax proposals was simple:
-
- A 3% tax on all household income over $200,000 per year in Brattleboro would generate between $252,000-333,000 per year in revenue, with a likely average of ~$293,000
- A 1% annual tax on all investable assets (net worth minus real estate and most retirement accounts) over $5,000,000 in Brattleboro would generate between $540,000-982,000 per year in revenue, with a likely average of $756,000
- The combination of these taxes, before accounting for deductions/capital flight/deadweight loss, would raise an average of ~$1.05 million in revenue per year.
It is worth noting that Brattleboro, given its relatively egalitarian income distribution compared with that of Vermont and the country at large, has a considerably poorer 1% than does the state as a whole. The threshold income of Brattleboro’s 1% is a mere 5/8ths that of the 1% in Vermont as a whole, and a paltry 1/3rd of that in the US. While the Brattleboro 1%s’ average incomes are a higher percentage of the national average, this is underwhelming when one considers that the Vermont 1%’s average is roughly equal to that of the national 1%. The downstream effects of this, in terms of wealth accumulation, have policy implications for Brattleboro; the Brattleboro 1% have just over half the investable assets per capita that the Vermont and US 1% do.
The same calculations for the Vermont-wide versions of the taxes are as follows:
-
- There are roughly 2406 households in Vermont’s top 1%, earning a minimum (as of 2019) of $319,000.
- The average income of top 1% households in Vermont is $817,000 per year.
- The threshold wealth for the top 1% in Vermont is $6.38 million (~$4.8 million in investable assets), and the average wealth of the top 1% is $16.3 million (~$12.2 million in investable assets)
The resulting revenue from the proposed state-level taxes would be as follows:
-
- A 3% tax on all household income over $319,000, an average of $498,000 in taxable income per 1% household, would raise ~$36 million in revenue per year.
- A 1% tax on household investable assets over $10 million, an average of $2.2 million in taxable assets per 1% household, would raise ~$52.9 million in revenue per year.
- The combination of these taxes, before accounting for deductions/capital flight/deadweight loss, would raise $88.9 million in revenue per year, nearly 9% of the current state budget.
- A 1% tax on investable assets at a reduced threshold of $5 million, which would cover nearly all investable assets held by Vermont’s top 1%, would generate ~$173 million in new revenue.
- The combination of the lower-threshold tax on investable assets and the top percentile income tax would generate $209 million in revenue per year (with the same caveats regarding avoidance and deadweight loss mentioned above).
Other interesting findings and necessary caveats of the research into potential revenue from “top percentile” taxes in Brattleboro and Vermont, both directly and tangentially related to the topic at hand, include:
-
- Wealth tax revenue estimates may be sharply underestimated, due to differences in income and wealth inequality rates (wealth Gini tends to be higher than income Gini). Those who earn very large incomes tend to invest the portion they don’t consume, causing both an increase in their income over time and a faster increase in their net worth. This results in a relationship between high-earner income and net worth where, for most people making between $200,000 and $1 million per year, average net worth is roughly twenty times annual income. For those making less than $200,000, the proportion falls sharply. Meanwhile, for those earning more than $1 million per year, the proportion rises sharply, with net worth rising to many times annual income.
- Vermont has greater inequality among its 1% than does the US as a whole; the difference between the threshold and average wealth of the Vermont 1% is roughly 2/3rds larger than that of the 1% throughout the country. This is likely due to the relatively smaller number of Vermonters, in percentage terms, worth between $10-15 million than in the US 1%; fewer of them per capita in Vermont leaves more room in the 1% for those worth $5-10 million, with an “ordinary” proportion having a net worth between $16 million and $100 million. Above $100 million, i.e. ultra-high net worth households, are practically nonexistent. This is supported by Vermont’s low inequality ceiling, with Vermont being one of only six states without any billionaires and having an average percentage of millionaires.
- While granular, distributionally-differentiated income data was plentiful for Vermont (less so for Brattleboro), finding useful data on the distribution of wealth proved far more difficult. Most of the available data tended to be quite out of date; the best data on average wealth for the 1% specifically came from 2010, for instance.
Introduction
The financial strain on municipal, state, and federal governments by the Covid-19 pandemic and resulting economic pressures have yet to be fully realized, but are likely to play out for years to come. The direct cost of fiscal stimuli and temporary revenue loss from the shutdown and ongoing public health risks are not even the whole story; much of the economic damage is permanent, with numerous small and medium-sized businesses either going bankrupt or leveraging to the hilt to keep the doors open. Either of those outcomes results in a tax shortfall; indeed, economists expect the general fund of the state of Vermont to shrink by $182 million in 2021 and a further $104 million in 2022. Even worse, because the crisis has tended to have a greater impact overall on the poor and middle class, the prospects for a broad-based economic recovery in the long term are lessened, with a K-shaped recovery looming (i.e. one in which the most well-off, have a strong recovery almost entirely separate from the rest of the economy, which is still mired in downturn).
In this divergence between the economic fortunes of the wealthy and the poor lies a potentially straightforward answer to the revenue concerns of public policymakers: tax those making and accumulating the most money. Even before the Covid-19 crisis, a number of states (from California and New Jersey to Maine and Connecticut) have created additional upper-income tax brackets that target their highest annual income households. So-called “Millionaire Taxes” have been quite successful, with a growing body of research suggesting they have negligible effects on the out-migration rates of the wealthy or local economic detriments. They also raise a large amount of revenue from those with the lowest last-dollar marginal propensity to consume.
Similarly, taxes levied against massive accumulated material assets have also gained political traction in recent years, mostly due to the growing recognition of how much wealth is really possessed by the richest 1% and .1% of households. This manifests perhaps most often in the macabre meme math, popular on social media, showing how transformative for large swaths of society the redistribution of wealth from a single man (Jeff Bezos) could be. For example, during the period 3/20-8/20, Bezos’s net worth increased by enough to pay every Amazon employee (over 400,000 people) a six-figure bonus. Such Tolkien-tantalizing modern treasure, at a time when most Americans have seen their incomes and net worths stagnate or decline for decades, are bound to spur resentments and demand for policies that address the inequity. For policymakers, no such resentment should be needed to believe imposing a tax on wealth is a good idea; it is enough to know that doing so can be a massive source of new revenue without major macroeconomic headaches.
High-Income Tax: A tax on household incomes over a certain threshold
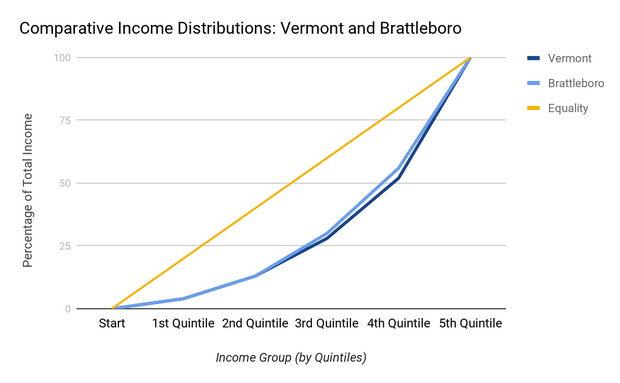
Brattleboro has considerably lower average income across all quintiles than the state-level average, and is more equally-distributed than the state as a whole.
-
- The difference increases among the top 20%, 5%, and 1% of income earners (by household), with each group in Brattleboro earning a smaller percentage of the income of their equivalent group at the state level than the one below it.
- Top 20%
- State Avg: $105.2k
- Bratt Avg: $83k
- % of State Avg: 78.9
- Top 5%
- State Avg: $183.4k
- Bratt Avg: $136.3k
- % of State Avg: 74.3
- Top 1%
- State Avg: $319k
- Bratt Avg: ~$200k
- Precise income threshold of the top 1% of households in Brattleboro cannot be easily determined. Estimate of ~$200k per year is based on the fact that 1.06% of all Brattleboro households earn more than $200k per year.
- Similarly, the average income of the top 1% of households in Brattleboro is unknown and must be estimated. Given that for Vermont as a whole, where the threshold for the 1% is $319k per year, the average income of the top 1% is $817k, a ratio of average to threshold can be derived and extrapolated onto Brattleboro. From there, given Brattleboro’s relative equality compared with the state as a whole, a likely range of average income can be established.
- Average-to-threshold ratio for Vermont 1%: 2.54:1
- Based on this ratio, the maximum average1% income in Brattleboro is $508k
- Given the Gini Coefficients of Brattleboro and the state as a whole, the likely average income of Brattleboro’s top 1% is roughly $471k per year.
- For the sake of treating the likely average as a mid-point, the minimum average income of Brattleboro 1% households is calculated at $434k per year.
- Therefore, average income of Brattleboro 1% households will be treated as ranging from $434-508k per year in revenue estimates for a Brattleboro high-income tax.
- % of State Avg: ~62%
- The difference between the average state-level and Brattleboro-level household incomes is most pronounced at the top and bottom of the income distribution, with both the wealthiest and poorest citizens of Brattleboro being markedly poorer than their state-level equivalents. Meanwhile, the difference is least pronounced among median households, with median Brattleboro households much closer to median Vermont households.
- The Gini Coefficient for Vermont as a whole is .444, versus .412 for Brattleboro (Vermont is less equal).
- The Gini Coefficient for Vermont as a whole is .444, versus .412 for Brattleboro (Vermont is less equal).
- Top 20%
- The difference increases among the top 20%, 5%, and 1% of income earners (by household), with each group in Brattleboro earning a smaller percentage of the income of their equivalent group at the state level than the one below it.
Due to the relatively low incomes of the highest earners in Brattleboro compared with the state as a whole, considerations must be made regarding how to go about taxing their incomes. While they are relatively well-off compared with the population as a whole, there is cause to be concerned that overtaxation or loosely-defined bracket parameters will impact the upper-middle class as well as the wealthy, a suboptimal outcome.
-
- A high additional rate, say 5% or more levied on the top 1% of income earners, could reduce the consumption rates of those closer to the tax threshold, causing more economic harm in the form of deadweight loss than a similar tax set at 3%.
- A tax levied on a wider range of households, say 3% of all income over $150,000 (as opposed to the proposed state-level tax of 3% on all households earning over $319,000 per year), could help to make up the revenue difference per capita between a high-income tax at the state level versus in Brattleboro. However, doing so would represent a divergence from the goals of the WST Project, which seeks to levy new taxes against the wealthy, not simply above-average earners.
Given that a high-income tax is only one leg of the WST Project tax proposals, the most practical course of action regarding Brattleboro specifically is to accept a level of revenue from such an income tax relatively lower per capita than that which would be expected from the state level equivalent, and to make up the difference through the other component tax, a tax on investable assets that would provide the necessary balance to generate additional revenue without diminishing returns due to double-taxation.
To estimate revenue from a high-income tax in Brattleboro, the following assumptions are made:
-
- The rate is 3%, the same rate as in the state-level proposal.
- The rate applies to top percentile income only, as in the state-level proposal.
- $200k works neatly as a figure that encapsulates the top 1% of Brattleboro households entirely; only 1.06% of all Brattleboro households make over $200k per year (roughly 36 households).
- The average income of top percentile households in Brattleboro is somewhere between $434-508k per year, with an assumed average of $471k per year. Revenue projections will be presented as a range based on those amounts.
Potential revenue generation from a 3% tax on incomes over $200,000 per year in Brattleboro:
-
- 36 Brattleboro households make over $200k per year, with an estimated average income of $471k per year. Therefore, an average of $271k per household would be subject to the tax (not accounting for deductions, long term capital gains exclusions, “crowding out”, and net capital flight).
- ($271,000*.03)36=~$292,700
- The average person subject to the tax would pay an additional ~$8,130 per year.
- The total revenue raised from such a tax would be approximately $293,000 per year.
- Given the range in estimates for the average income of the top 1% of households in Brattleboro, the likely range of revenue raised would be $252k-333k per year.
- Average taxable income range of $234k-308k
- Given the range in estimates for the average income of the top 1% of households in Brattleboro, the likely range of revenue raised would be $252k-333k per year.
- 36 Brattleboro households make over $200k per year, with an estimated average income of $471k per year. Therefore, an average of $271k per household would be subject to the tax (not accounting for deductions, long term capital gains exclusions, “crowding out”, and net capital flight).
Wealth Tax- A tax on high levels of household wealth
For most of the same reasons Brattleboro’s 1% have lower annual incomes than their 1%counterparts in the state writ large, they also have far less wealth. This has ramifications for any attempt to raise revenue by taxing the wealth of Brattleboros most well-off households.
-
- “Wealth” is here defined as investable assets (i.e. excluding housing and certain types of investment accounts, like employer-based retirement accounts)
- Such a tax would ideally, at a minimum, be levied only on those households with over $1 million in investable assets.
- In Vermont, there are 15,363 households with investable assets of over $1 million. This is about 5.88% of all Vermont households.
- Average investable assets of the wealthy, given that detailed data for Brattleboro (and even, to a lesser extent, Vermont) is unavailable, can best be estimated through comparisons between Brattleboro, VT, and the USA as a whole.
- This is reflective of the larger issue with estimating wealth in general; data is spotty, and often only provides a partial picture of the overall amount of wealth possessed by the top 1%. Much of the data is old, without recent updates, and not particularly tailored to this task. Nonetheless, much can be pieced together to provide some basis for a loose revenue projection from taxing wealth, provided that projection is taken with both a grain of salt and an eye for the range of the estimates.
How much do the wealthy have in investable assets?
-
- In the US
- In 2010, the minimum net worth to be in the top 1% was $10.4 million, and the average net worth (including non-investable assets) of the 1% was $16.4 million.
- On average, non-financial holdings (like real estate) make up roughly a quarter of an American’s wealth. This makes estimating the investable assets of the 1% as averaging three-quarters of their net worth a conservative underestimate, as the wealthy are more likely to favor financial assets over non-financial ones, which is advantageous in estimating revenue from taxing their wealth. An underestimate is generally preferable to an overestimate.
- Therefore, the average investable assets of the top 1% of Americans is ~$12.3 million.
- The average net worth-to-income ratio for the wealthiest American households is roughly 20:1. This conforms reasonably neatly with the ratio of entry threshold incomes and net worths to qualify as “1%”, $604,000 in income vs. $10.4 million in net worth in 2010. It conforms more closely with the average income and net worth of the 1% for 2010, ~$820,000 and $16.4 million respectively.
- The 20:1 ratio correlates most closely with the population data near the mean/median; income tends to be a larger percentage of net worth at lower net worths, and a smaller percentage as net worth rises.
- In Vermont
- The threshold income of the top 1% of Vermont households is $319,000 per year, with an average income of $817,000. Using the 20:1 ratio, one would surmise that the threshold net worth of 1% households in Vermont is roughly $6,380,000, and that the average net worth of VT 1% households is $16.3 million.
- The rate of inequality among Vermont’s top 1% households is higher than throughout the nation as a whole. While the minimum income and net worth required to be “1%” are lower in Vermont than the country as a whole ($6.4 million vs $10.4 million in net worth), the average net worth of Vermont’s 1% is roughly equal to the average of those in the country as a whole ($16.3 million vs $16.4 million). Given Vermont’s lower Gini coefficient than the nation at large, this disparity is likely due to a mix of relatively few households in the $10-17 million range, relatively more people in the $5-10 million range, and very few ultra-high net worth individuals (supported by the fact that the wealthiest Vermont resident is worth less than $1 billion). This has several implications for taxation in Vermont.
- One, there is likely less overall taxable wealth per millionaire than in the US economy as a whole. The wider disparity between Vermont’s threshold and average wealth means one of three things, or a combination thereof: a smaller proportion of the 1% in Vermont has a net worth over $10.4 million, the total wealth of the 1% per capita in Vermont is nearly equal to that of the country per capita, and the percentage of people subject to a wealth tax (set to any given level) is likely to be smaller in Vermont than the US as a whole. The wealth distribution of Vermont’s 1% is both shorter than that of the US, and skews further downward.
- Two, any wealth tax in Vermont is likely to affect the individual households of Vermont’s 1% in different ways, compared with the more homogeneous impact of such a wealth tax in the US as a whole. A wealth tax of, for example, 1% per year on all investable assets over $5 million, would cost the poorest top percentile Vermonters ~$14,500 annually, but the average top percentile Vermonter $113,000 per year, a nearly 8-fold difference. This compares with the more equal costs to the 1% nationally, where the poorest would pay $54,000 per year while the average pays $114,000, a much narrower difference. This is advantageous, as it suggests that such a tax would be more progressive in Vermont, and potentially perceived as more fair to the upper-middle class.
- Given the estimated quarter of net worth made up of non-investable assets, this puts the average investable assets of the Vermont 1% at $12.2 million.
- There are roughly 2,406 households in the top 1% in Vermont.
- A tax of 1% per year on all Vermont wealth (in the form of investable assets) over $5 million would yield revenue for the state of approximately $173 million per year, before exemptions and capital flight.
- (($12.2m-$5m)*.01)*2406=~$173,000,000
- A tax of 1% per year on all Vermont wealth (in the form of investable assets) over $10 million would yield revenue for the state of approximately $53.9 million per year, before exemptions and capital flight.
- (($12.2m-$10m)*.01)*2406=~$53,900,000
- A tax of 1% per year on all Vermont wealth (in the form of investable assets) over $5 million would yield revenue for the state of approximately $173 million per year, before exemptions and capital flight.
- The rate of inequality among Vermont’s top 1% households is higher than throughout the nation as a whole. While the minimum income and net worth required to be “1%” are lower in Vermont than the country as a whole ($6.4 million vs $10.4 million in net worth), the average net worth of Vermont’s 1% is roughly equal to the average of those in the country as a whole ($16.3 million vs $16.4 million). Given Vermont’s lower Gini coefficient than the nation at large, this disparity is likely due to a mix of relatively few households in the $10-17 million range, relatively more people in the $5-10 million range, and very few ultra-high net worth individuals (supported by the fact that the wealthiest Vermont resident is worth less than $1 billion). This has several implications for taxation in Vermont.
- The threshold income of the top 1% of Vermont households is $319,000 per year, with an average income of $817,000. Using the 20:1 ratio, one would surmise that the threshold net worth of 1% households in Vermont is roughly $6,380,000, and that the average net worth of VT 1% households is $16.3 million.
- In Brattleboro
- Estimates of wealth and investable assets in Brattleboro will rely heavily upon the following assumptions laid out above:
- Net worth among top percentile households averages roughly twenty times their annual incomes, and is relatively higher proportionally at lower levels of net worth than at higher levels, due to a mix of different ratios among retirees, higher rates of capital investment among ultra-high net worth households, and the roles of experiential compensation and wealth accumulation over time.
- Investable assets average 75% as a portion of overall net worth for top percentile households.
- The level of wealth inequality is equal to the level of income inequality, implicit in the assumption that top percentile net worth averages twenty times top percentile income. This assumption is almost certainly incorrect; the level of wealth inequality in the US is vastly higher than the level of income inequality (~.8 vs. .48, in Gini terms), and there is little to suggest this relationship is not also true for Vermont and Brattleboro. However, it is a useful assumption, insofar as it tends to result in a conservative estimate of potential revenue from a tax on wealth. If a margin of error is necessary, it should be pointed in the direction of a pleasant surprise for the town treasury, rather than a glaring shortfall.
- The threshold for 1% income in Vermont is $319,000 per year and ~$200,000 in Brattleboro. The average top percentile household income is $817,000 per year in Vermont and $471,000 in Brattleboro (estimated to be in the range of $434,000-508,000)
- The threshold for top 1% net worth in Vermont is $6.4 million, and the average top 1% net worth in Vermont is $16.3 million.
- Brattleboro’s wealth distribution among the top 1%, in comparison with Vermont, likely looks quite similar to a comparison of Vermont and the US; Brattleboro has relatively few households with investable assets over $10 million, very few (if any) ultra-high net worth households, and relatively more households with between $5-10 million. This is supported by both the lower threshold and average incomes of the Brattleboro 1% compared with the rest of the state.
- The threshold investable assets of the Brattleboro 1% equal 75% of their net worth. If 1% net worth equals roughly twenty times 1% annual income, the top 1% of Brattleboro has a minimum net worth of $4,000,000 and a minimum investable asset level of $3,000,000. Meanwhile, the average net worth of the Brattleboro 1% is ~$9.4 million, and their average investable assets are roughly $7.1 million. This average is within a range of ~$6.5-7.7 million.
- Given these results, the possibility of a 1% tax on investable assets over $10 million only will be dismissed as a policy possibility for Brattleboro. So few households would be affected by such a tax, and to such a minimal extent, that the political costs clearly outweigh any economic benefits. Only the 1% tax on investable assets over $5,000,000 will be examined and considered for Brattleboro.
- If the average Brattleboro 1% household has $7.1 million in investable assets, then $2.1 million per household would be subject to a 1% tax on investable assets over $5,000,000. Given 36 households are in Brattleboro’s 1%, this would result in an average tax increase of $21,000 per household and fresh municipal revenue of roughly $756,000 (before adjustments and deductions) per year.
- Revenue would likely range from $540,000-982,000 per year. This range is based on income estimates and does not include potential taxation on wealth that has not been estimated (due to pegging wealth and income Ginis to one another). It is possible that total revenue from a wealth tax in Brattleboro could exceed $1 million per year.
- Estimates of wealth and investable assets in Brattleboro will rely heavily upon the following assumptions laid out above:
- In 2010, the minimum net worth to be in the top 1% was $10.4 million, and the average net worth (including non-investable assets) of the 1% was $16.4 million.
- In the US
Conclusion
The threat to the economic future of Brattleboro and Vermont from revenue shortfalls and stagnation is all too clear. The foundations of public spending must remain strong, or the public services that contribute to our high quality of life will surely suffer. With this in mind, it is equally clear that those best able to bear the cost of preventing those shortfalls are the wealthiest Vermonters. With the introduction of modest taxes on high incomes and investable assets, both Brattleboro and Vermont would generate millions in new revenue, sustaining existing spending and better preparing both for the trials of years to come. The start of the new decade has provided little indication of future stability or ease; Marshalling the resources to solve problems now will prepare us to solve those of tomorrow.
References
Household Income in Brattleboro, Vermont (Unincorporated Place)
The Demographic Statistical Atlas of the United States
Millionaires in America 2020: All 50 States Ranked
Six facts about wealth in the United States
Net Worth of Households: 2016
The State of Working America’s Wealth, 2011
https://www.investopedia.com/financial-edge/1212/average-net-worth-of-the-1.aspx#citation-4
Decades of rising economic inequality in the U.S.: Testimony before the U.S. House of Representatives Ways and Means Committee
The new gilded age: Income inequality in the U.S. by state, metropolitan area, and county
Distribution of wealth in the US 2020
The Fed – Changes in US Family Finances from 2013 to 2016: Evidence from the Survey of Consumer Finances
A Guide to Statistics on Historical Trends in Income Inequality
How Much Income Puts You in the Top 1%, 5%, 10%?
Visualizing Where Millionaires Live in the United States
Economists project ‘massive’ revenue losses for Vermont for next two fiscal years
This Post Has 0 Comments